Charts
Install to Trial
Learn what the Install to Trial chart measures and when to use it.
What it shows
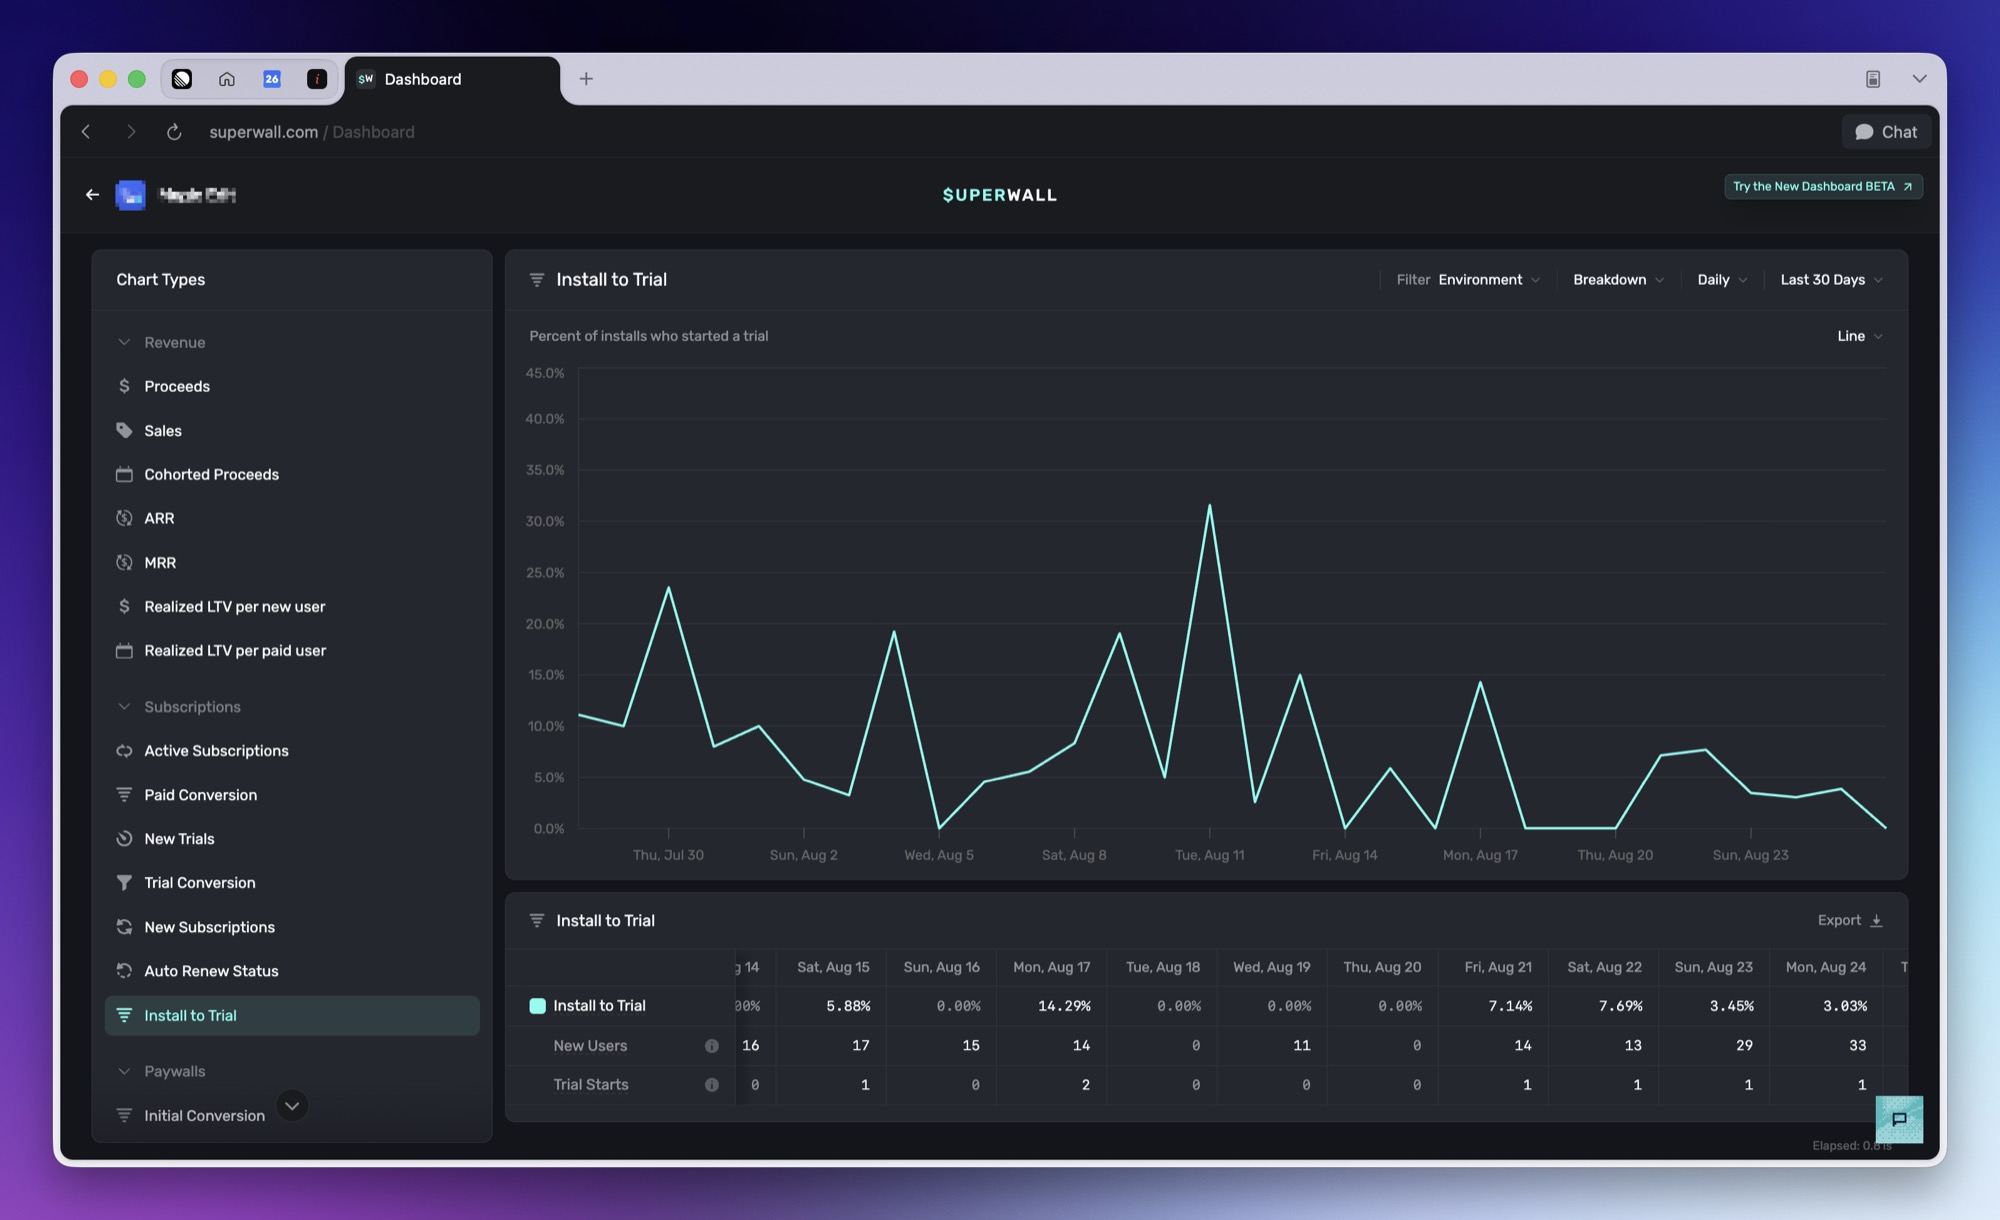
Install to Trial shows the percentage of installs that started a trial.
How to use it
Use this chart to see how well new users move into a trial. It is the step before Paid Conversion, which measures how many installs went all the way to paying.
Good to know
Install to Trial divides by installs, which web platforms don't report, so treat it as mobile-only. Stripe apps never see it. Paddle, promotional, and web checkout apps may still list it in the chart picker, where it has nothing meaningful to divide by.
Install to Trial sits downstream of several steps. If it drops, compare it against Paywall Rate and Paywall Conversion to find where the funnel changed.
How is this guide?